|
<< Click to Display Table of Contents >> Graphs Menu |
  
|
|
<< Click to Display Table of Contents >> Graphs Menu |
|
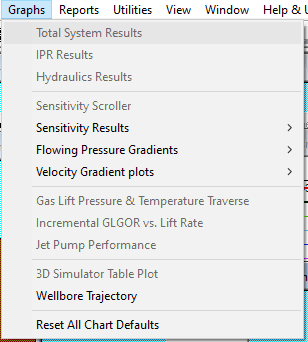
Graphs Menu
All the graph properties can be edited by right-clicking anywhere on the plot. These changes are only temporary unless you save the new format.
You can save any of the graph formats by pressing Ctrl-s after editing the graph properties.
The Graphs menu offers the following options:
Show classic nodal plot of rate vs. Pressure |
|
Show IPR plot only |
|
Show hydraulics curves only |
|
Open Sensitivity Scroller tool that provides a means to graphically adjust most parameters and see the immediate effect of the change on the total system graph. |
|
This option will show 4 choices for plots of Rate/Pressure versus sensitivity parameter for both IPR and Hydraulics (if available). |
|
Tubing pressure profiles (VLP) are provided for each rate and sensitivity, as well as the solution rate. |
|
Velocity profiles are provided for each rate and sensitivity along the length of the wellbore. The minimum lift velocity is also provided along the wellbore. |
|
This plot is only available for detailed gas lift cases and will automatically update when the case is run. |
|
Show Incremental GOR vs. Lift rate plot |
|
This plot is only available for Jet Pump cases and will automatically update when the case is run. |
|
This little-used feature shows a 3D plot of a BH pressure surface for the rates, WHP, and Gas lift rates generated. |
|
Shows the side-view of the wellbore accounting for changes in inclination, but not azimuth. Useful in determining if horizontal ections are toe up or down. |
|
Reset all .oc2 files to original settings. This is a faster option than re-installing and can repair graph layouts that have been "broken" past the point of repair. |