|
<< Click to Display Table of Contents >> Total System Plot |
  
|
|
<< Click to Display Table of Contents >> Total System Plot |
|
Total System Results
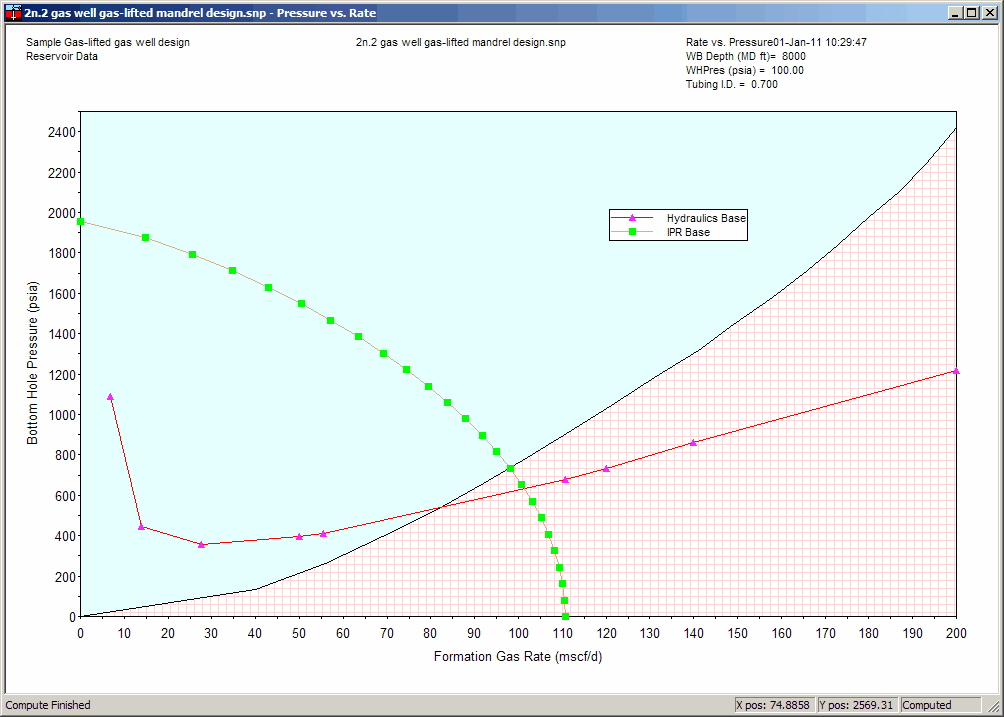
The main rate versus pressure plot shows when this graph option is selected. Any line on the plot can be highlighted by left-mouse-clicking on the legend item. Hold down on the button to keep the item highlighted.
All the graph properties can be edited by right-clicking anywhere on the plot. These changes are only temporary unless you save the new format.
You can save any of the graph formats by pressing Ctrl-s after editing the graph properties.
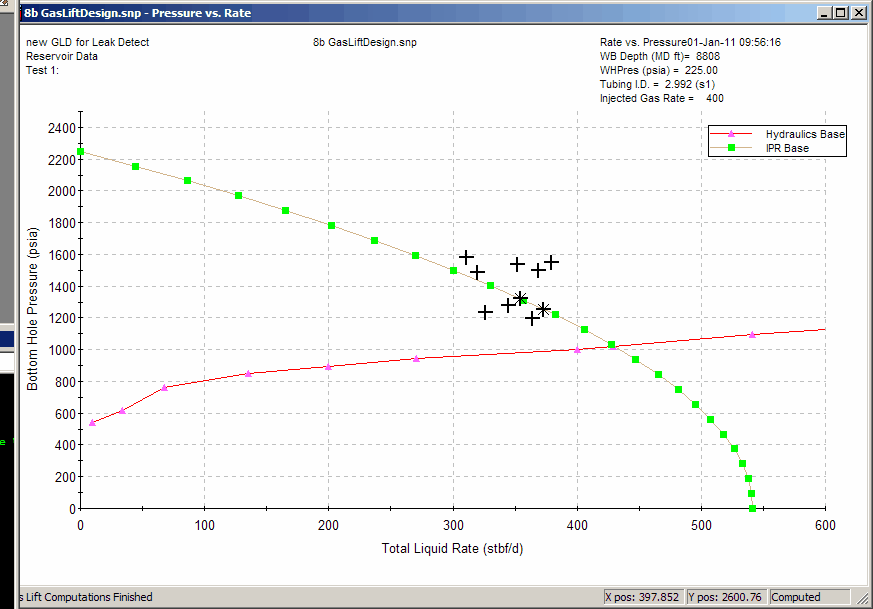
If the "Show loading rates" option is selected from either the tool bar or the Global Preferences, the plot will indicate those rates below loading rates in Blue (referenced against the top wellbore segment) and those areas with rates above unloading rates in a crosshatch pattern. This plot is available for both gas and oil wells, but is most relevant for gas wells.