|
<< Click to Display Table of Contents >> Velocity Gradient Plots |
  
|
|
<< Click to Display Table of Contents >> Velocity Gradient Plots |
|
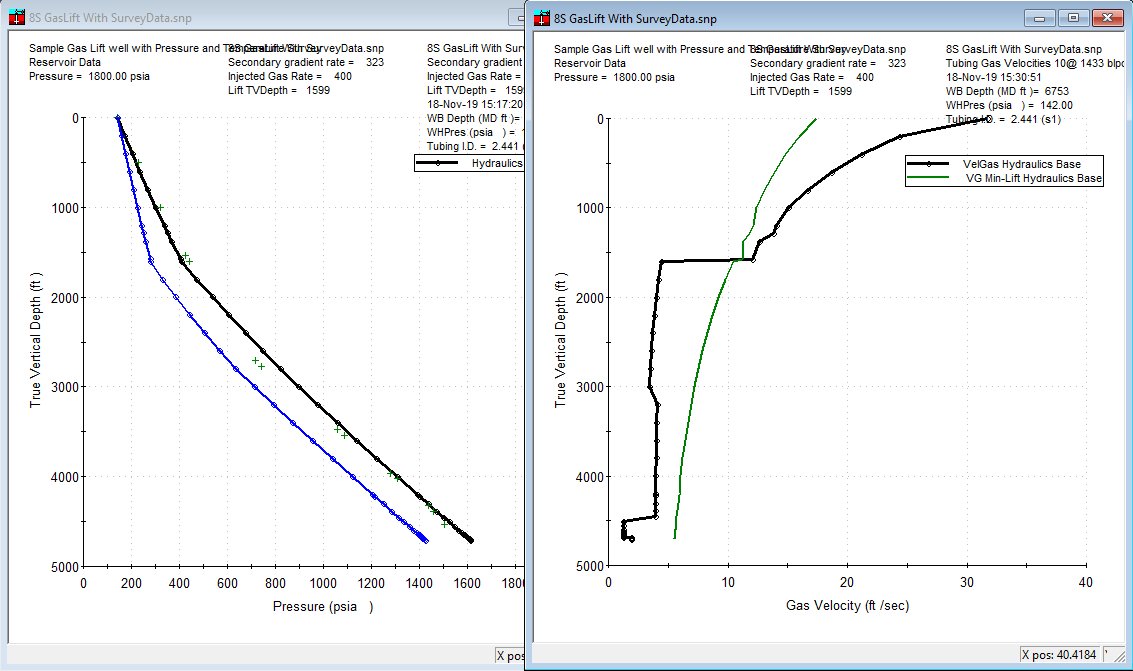
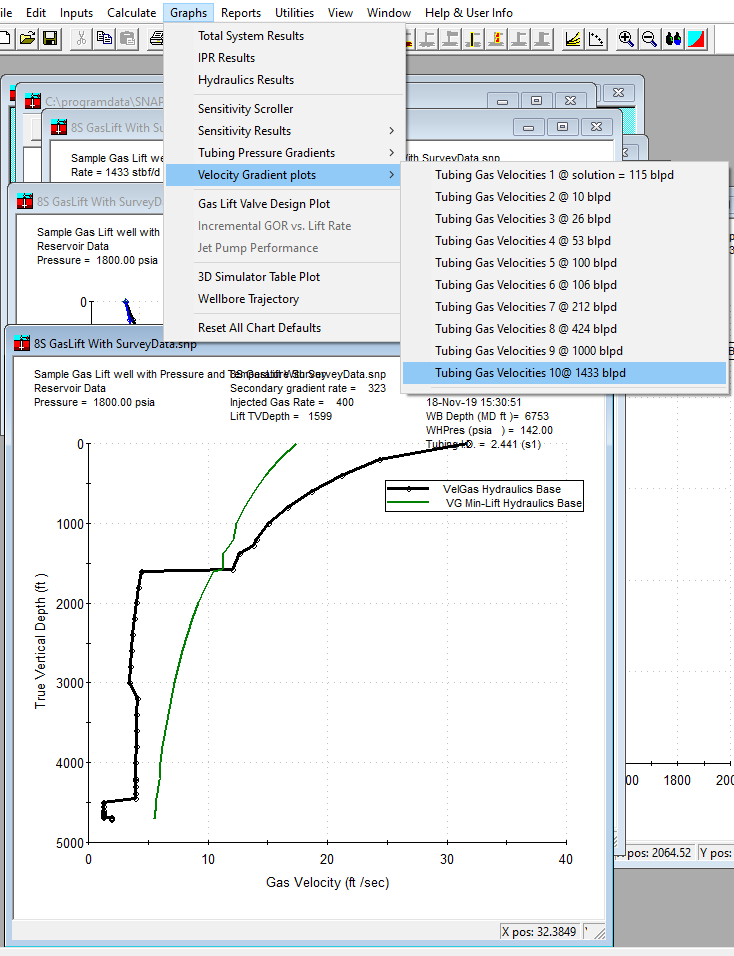
Velocity Gradient plots show the speed of the gas within the flowpath compared to minimum lift velocities under similar pressure and temperature conditions. These plots are activated through the Graphs->Velocity Gradient Plots menu. This menu item is disabled until a run is made.
In the case below, a complex wellbore is loading up below 1500 feet where gas injection is taking place.
This plot compliments the Tubing pressure gradient plot as is shown in the case below.