|
<< Click to Display Table of Contents >> Tubing Pressure Gradients |
  
|
|
<< Click to Display Table of Contents >> Tubing Pressure Gradients |
|
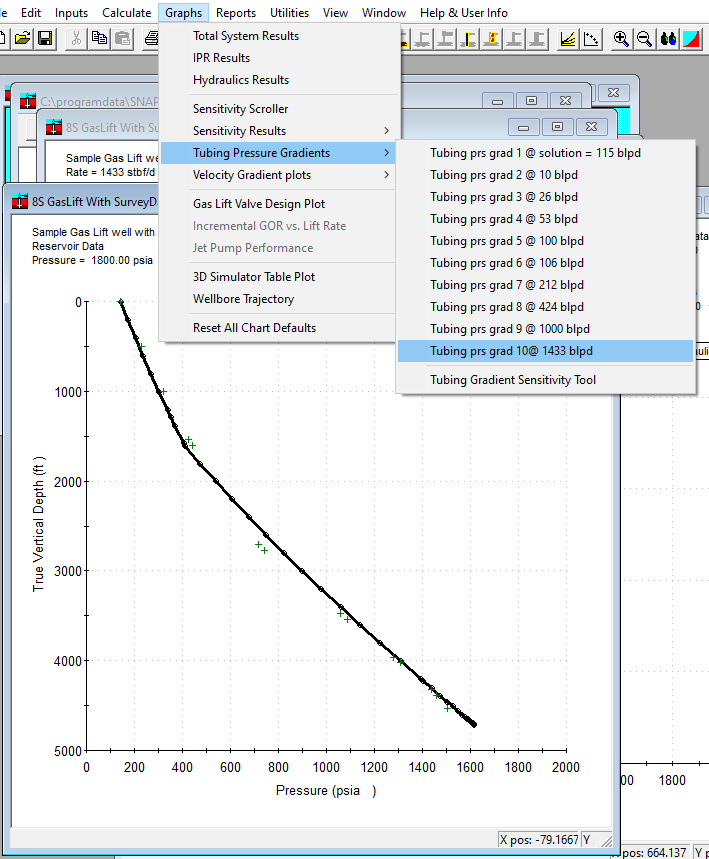
Pressure gradients vs. depth are shown in the Graphs-> Tubing Pressure Gradients menu. This menu is disabled until a run is made.
The top menu item is usually the solution rate, while the menu items below that are each of the rates run in the hydraulics.
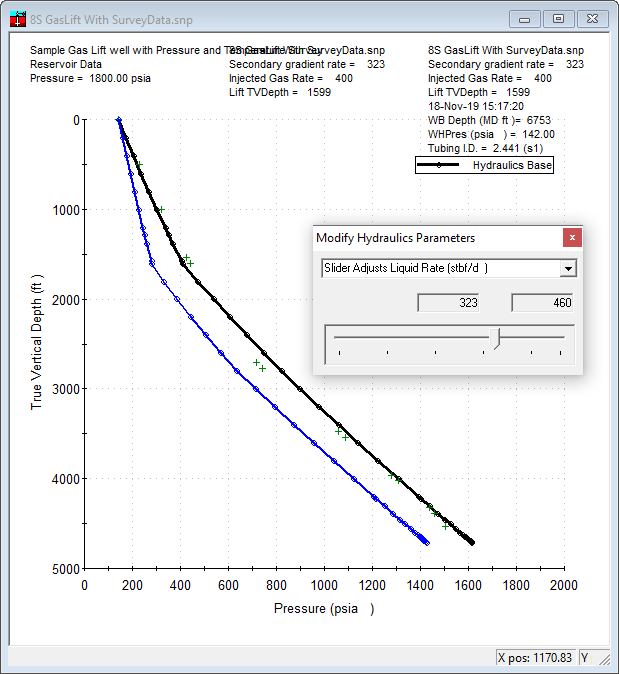
If pressure survey data is entered, it will appear on these plots, however, please note that the survey data is taken at one rate, and these plots are available for a variety of rates. It is not wrong to plot the survey data on a VLP representing a different rate, but one should note as much so that others don't confuse the two.
The last item in this menu is the tubing gradient sensitivity tool. You should first open a gradient plot that you want to review, then select this option.
This little panel will place a second rate curve on the active plot and provide a method to quickly see what other rates would look like on the same plot.
Similar multi-rate options are on the GasLift panels.