|
<< Click to Display Table of Contents >> Wellbore Trajectory |
  
|
|
<< Click to Display Table of Contents >> Wellbore Trajectory |
|
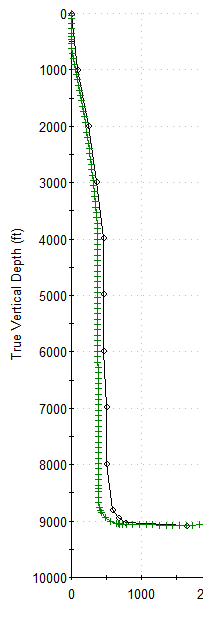
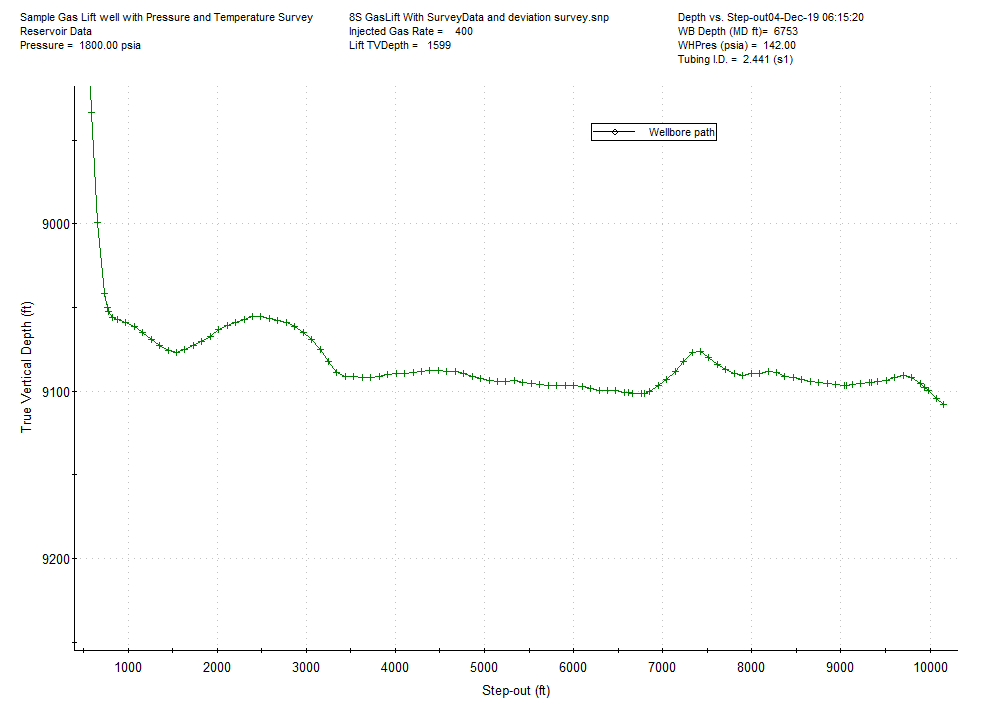
The wellbore trajectory plot shows a view of the wellbore from the side, ignoring azimuth changes. This plot can be helpful in determining the extent of a toe-up or toe-down condition.
If available, wellbore deviation surveys are shown on this plot in addition to the wellbore sements. To use the deviation surveys, just enter values for MD, and the TVD values will update automatically to match the survey.
The following trajectory:
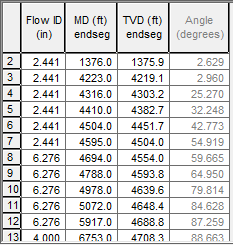
Generates the following simple plot.
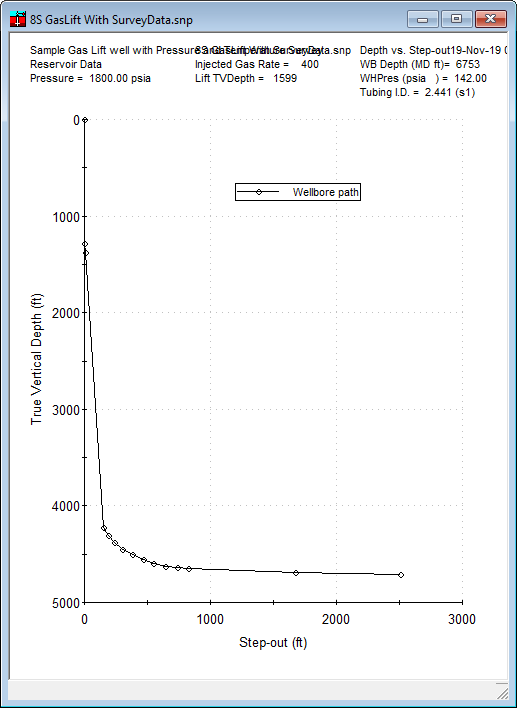
The following plot shows unsynchronized entries.
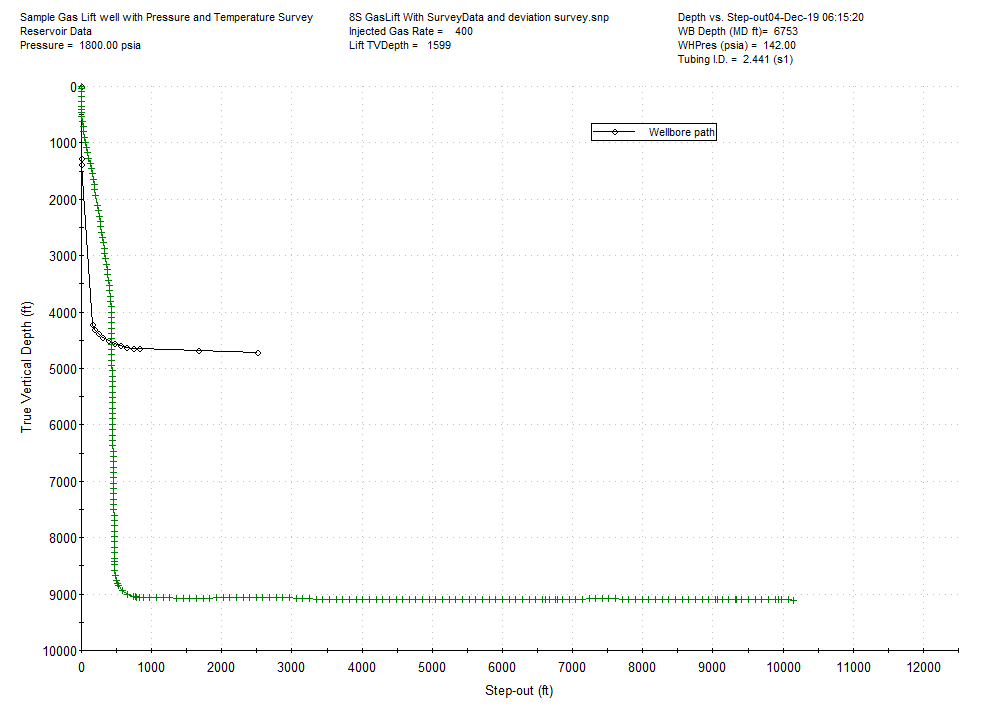
When zoomed in, the horizontal section looks like below.
When synchronized, the plot looks like below.