|
<< Click to Display Table of Contents >> IPR Sensitivities Plots |
  
|
|
<< Click to Display Table of Contents >> IPR Sensitivities Plots |
|
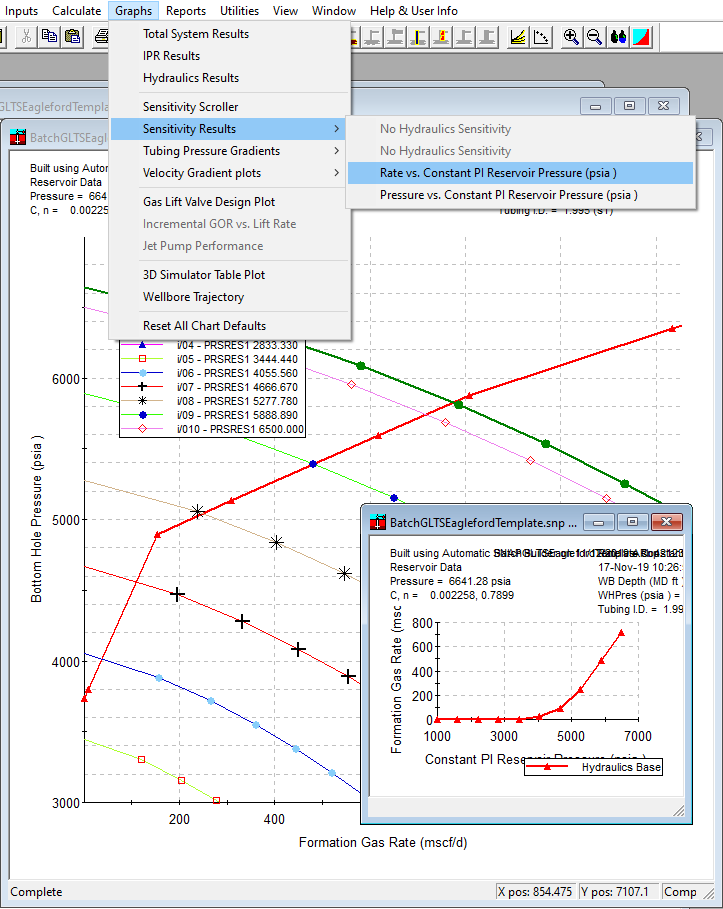
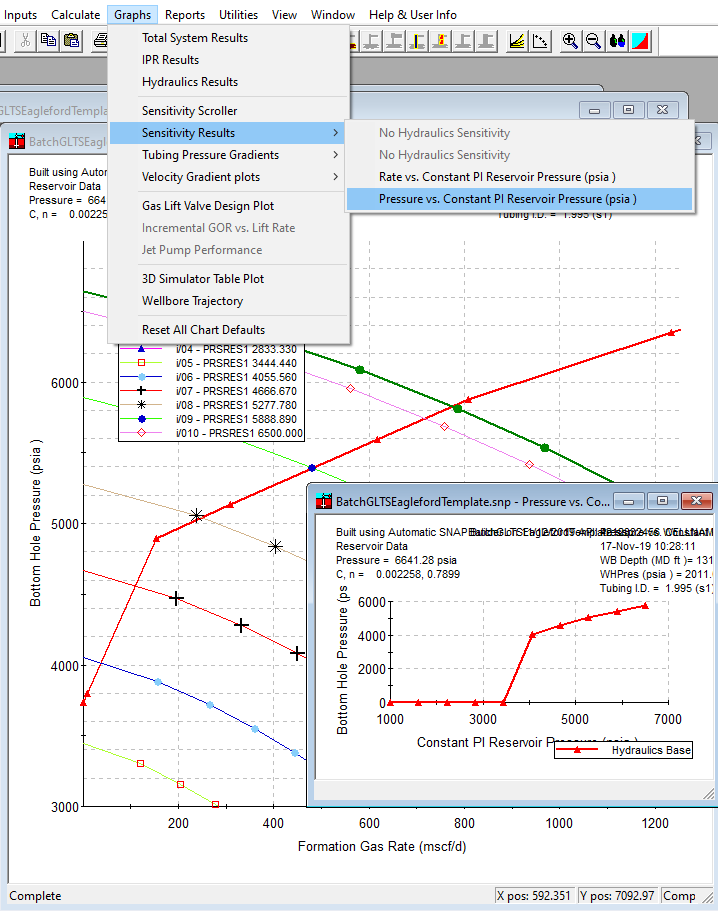
Sensitivity plots show the sensitized parameter compared to rates or pressures. They are activated through the Graphs->Sensitivity Results menu. This menu item is disabled until a run is made and are not available if no sensitivities are defined.
Sample IPR Sensitivities plots are below: