|
<< Click to Display Table of Contents >> Survey Data Example Results Plot |
  
|
|
<< Click to Display Table of Contents >> Survey Data Example Results Plot |
  
|
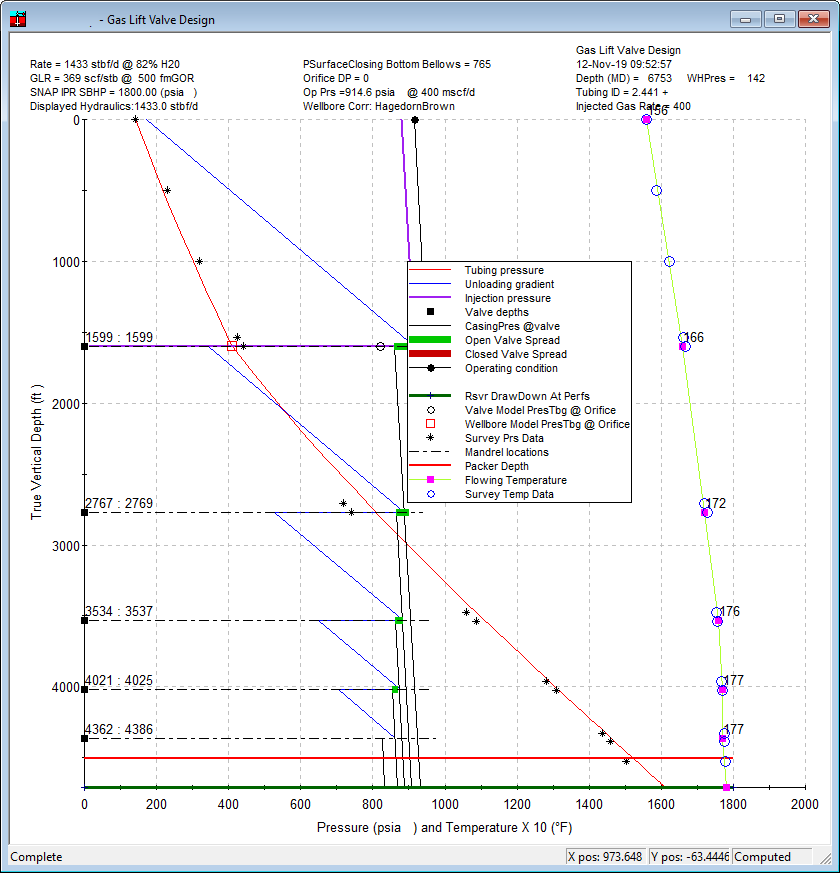
The black stars are the pressure data, while the open blue circles are the temperature data. Remember that keyboard hotlink Ctrl-s will save most formatting changes made to most plots so that they are permanent.
