PROCAST©
Production Rate Forecasting Model
PROCAST© provides the tools for predicting rate performance and optimizing field-wide production. PROCAST© facilitates ease of data entry and provides a capacity to track a variety of development scenarios. Also, the program uses system analysis, material balance concepts, and reservoir and well data to forecast reservoir performance. It gives flexibility in scheduling, grouping, and tracking reservoir and well data. Lastly, it illustrates predictions.
Theory
PROCAST© is based upon a simple rate forecasting model using
deliverability data and a tank reservoir model.
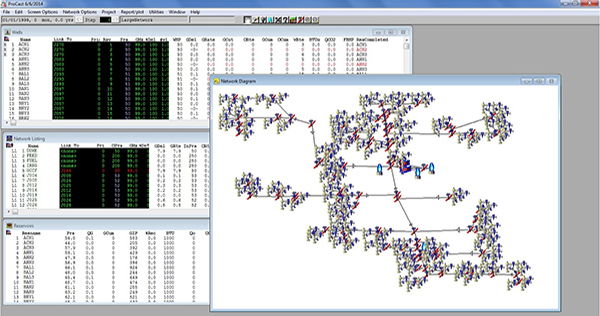
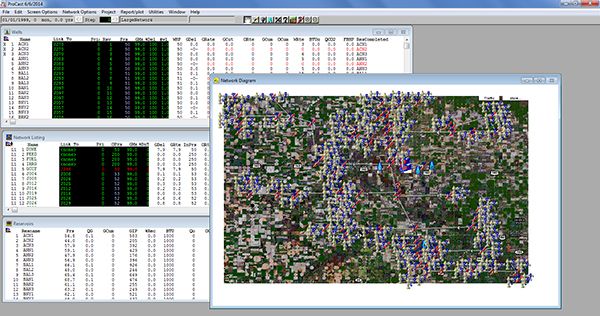
Where PROCAST© differs from what can easily be done in a spreadsheet,
is in its handling of complex and extensive gathering systems, and
detailed deliverability relationships. Coupled with real-time
network and well constraints, the program will provide a flexible and
powerful forecasting tool for evaluating facility modifications,
production allocation schemes, or even simple well forecasting with
minimal data input.
In its simplest form, forecasting the production of a reservoir
consists of merging the data from a two independent relationships: the
pressure-cumulative production relationship for the reservoir and the
well deliverability characteristics. Neither of the two has
a component of time, but used together, the synthesis of a rate-time
plot is possible.
Beginning with the initial reservoir pressure, a corresponding p/z
value is calculated. Using a defined p/z vs. cumulative gas
production trend or simply the OGIP, the reservoir pressure at any
cumulative gas production can be found. Starting with the
initial reservoir pressure, and some assumed flowing tubing pressure, a
deliverability value for the well, Q, is calculated. Making
an arbitrary time step will produce the well at the pre-defined rate,
and deplete Q*time reserves from the reservoir. With the new
calculated cumulative gas production, the new reservoir pressure can be
calculated from the depletion (p/z) curve.
Following the same (circular) logic, the new reservoir pressure will be
lower than the original reservoir pressure and the well deliverability
will decline concurrently. Using this new deliverability, the
process starts over and a second time step is taken. The current
version of the program does not expand upon this forecasting
methodology with any of the numerical solution techniques that are
available. Any improvement in accuracy will come with a cost in
computation time. Release version 1.0.71b takes an intermediate
approach by taking a maximum internal time step of one month,
regardless of the actual total time step requested.
As program usage increases, improved solution methods can be
implemented if the current methodology proves inadequate. In
addition to the primary phase, condensate yield vs. pressure curves for
each reservoir can be used to predict liquids deliverability. In
contrast with the prior GASMAN program, the interpolation routines in
PROCAST© are very stable and will provide a value based on a two
dimensional surface interpolation using the Lagrange 3 point
methodology for internal points to the solution and a two point
extrapolation when a value outside the defined range is
requested. With a sure value comes possible erroneous values, so
negative rates are eliminated and a color coding scheme is used to
indicate if a deliverability value is independent of surface pressure
(RED) or outside the bounds of the defined deliverability curves (BLUE).