FORECAST©
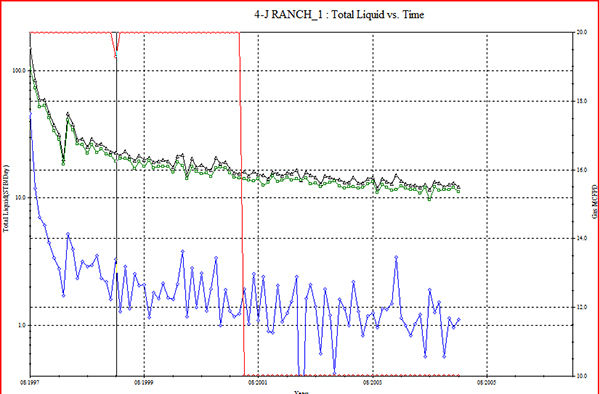
FORECAST© is designed to model complex decline. FORECAST© includes ARPS, WOR, P/Z, Marginal GOR and Arps Oil/Water/Gas Analysis.
The Decline Types
he
basic parameter of conventional decline curve analysis is the
fractional decline rate, D, defined as the change in production rate
per unit time per unit production rate. Mathematically, D is
defined by
D = -(1/q)*(dq/dt)
where q is the production rate, t is the time, and dq/dt is the derivative of production rate with respect to time. The dimension of D is the reciprocal of time.
After studying the production
rate history from 149 fields, Arps proposed three equations to describe
the production rate decline in petroleum reservoirs: the exponential;
the hyperbolic; and the harmonic equation. The three decline
equations differ by the way the fractional decline rate, D, is assumed
to vary with time and production rate. The exponential decline
equation assumes D is constant. As a result, it is commonly
referred to as the constant decline equation. The harmonic
decline equation assumes D is proportional to the production
rate. The hyperbolic decline equation assumes D is proportional
to the production rate raised to the power n, where n is a fraction
between zero and one.
Inherent Assumptions
Arps
proposed three decline equations on purely empirical grounds and
without any theoretical basis. However, even through the
reservoirs used by Arps covered a wide rage of reservoir
characteristics and drive mechanisms, they shared a common operating
mode, spacing, and productivity range. This imposed some inherent
assumptions:
1. The production rate data was in
the boundary dominated flow regime. This is equivalent to the
pseudo steady state flow regime observed under constant rate production
in pressure transient testing. The time to reach this flow regime
depends on the permeability, the porosity, the total system
compressibility, the fluid viscosity, and the drainage area. The
reservoirs studied by Arps had relatively high permeability and were
developed using closer well spacing. As a result, the data Arps
used mainly in the boundary dominated flow regime. These
equations should not be used, for example, in tight gas reservoirs,
where the time to reach the boundary dominated flow may take months to
years.
2. The flowing bottom hole pressure is constant. The
reservoirs considered by Arps were operated without any allowable
restrictions, and were produced wide open near maximum production
rate. This is close to a constant flowing bottom hole pressure
production.
3. The well is continuously on production. In practice,
this is usually not the case, since a well is frequently shut in for
various operational reasons. The effects of any production
interruption can be removed by plotting the data in terms of longer
time units, such as every month, six months, or a year.
The Decline Exponent and the Drive Mechanism
We
know that higher exponents indicate a slower decline and higher
recovery. Therefore, we expect a water drive reservoir, for example, to
exhibit a higher exponent than a solution gas drive.
The expected range of the exponent, based on Arps data, is between zero
and 0.5. Values higher than one are usually the result of using
conventional decline analysis to production rate data in the transient
flow regime.
WOR versus Cumulative Produced Oil
A
common method of analyzing the performance of waterfloods is to plot
the WOR versus cumulative produced oil for a field or group of wells.
In mature (post-break through) waterfloods the log of WOR versus
cumulative produced oil is a linear relationship. Oil rate decline
curves obtained from this method are hyperbolic (or harmonic) in nature.
This technique is based on the one-dimensional Buckley-Leverett frontal
advance equation for linear, immiscible displacement.

